
收稿日期: 2018-08-01
网络出版日期: 2020-12-29
基金资助
国家自然科学基金资助项目(51678351)
Quantification of dominant algal species in water reservoir by measuring two-dimensional projection characteristic values of algal clusters
Received date: 2018-08-01
Online published: 2020-12-29
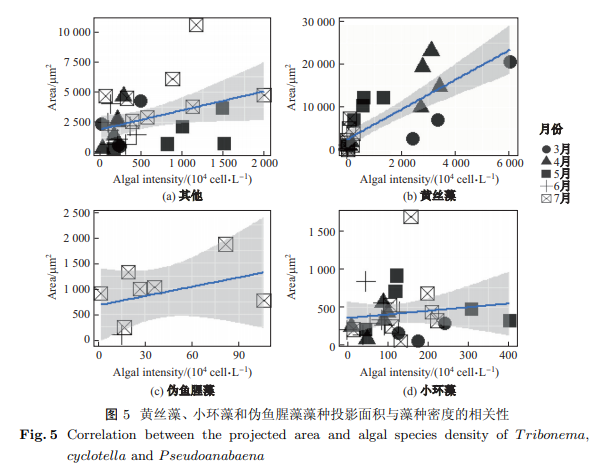
2015年3~7月对华东某水源水库开展了藻种类、密度与显微镜检藻团2维投影特征值调查.结果表明, 该水库藻种分布的季节性演替规律明显,春季黄藻门的黄丝藻为优势藻种, 占比达到78.9%~92.6%.黄丝藻藻团特征明显,2维投影面积与藻密度有较高的相关性(R2=0.712).采用分类回归树(classification and regression tree,CART)方法开展实际水样中典型藻种(黄丝藻、小环藻和伪鱼腥藻)的统计回归分类,识别率分别达到83%、68%和86%.藻团2维投影特征度量方法结合图像识别技术,有望实现水中藻团的快速识别与特征测量.
苏青青 , 郦春蓉 , 王先云 , 张东 , 黄鑫 . 藻团2维投影特征值定量水源水库中优势藻种[J]. 上海大学学报(自然科学版), 2020 , 26(6) : 980 -988 . DOI: 10.12066/j.issn.1007-2861.2102
From March to July 2015, a microscopic survey on species, density, and two-dimensional projection characteristic values of algal clusters showed the obvious seasonal succession pattern of algal species distribution in the reservoir. Tribonema (Xanthophyta) was the dominant algae in spring, accounting for 78.9% to 92.6% of algal clusters, with high correlation between two-dimensional projection area and cell density (R2=0.712). Classification and regression tree (CART) method was used to identify Tribonema, Cyclotella, and Pseudanabaena, with effective recognition rates of 83%, 68%, and 86%, respectively. The two-dimensional projection and image recognition technology were expected to realize rapid identification and characterization of algal clusters in water.
| [1] | 彭青, 谢冰, 袁琦, 等. 青草沙水库蓄水期间细菌群落结构变化的初步研究[J]. 环境科学, 2012,33(10):3634-3640. |
| [2] | 任翔宇, 王铭玮, 顾詠洁, 等. 光照强度及温度对青草沙水库蓝藻暴发风险的模拟试验[J]. 净水技术, 2012,31(4):55-60. |
| [3] | Cao H S, Zhou Y. Variation in colony size of Microcystis aeruginosa in a eytrophic lake during recruitment and bloom formation[J]. Journal of Freshwater Ecology, 2010,25(3):331-335. |
| [4] | Yamamoto Y, Nakahara H. Seasonal variations in the morphology of bloom-forming cyanobacteria in a eutrophic pond[J]. Limnology, 2009,10(3):185-193. |
| [5] | Wang C, Wu X, Tian C, et al. A quantitative protocol for rapid analysis of cell density and size distribution of pelagic and benthic Microcystis colonies by FlowCAM[J]. Journal of Applied Phycology, 2015,27(2):711-720. |
| [6] | 范帆. 巢湖市水源保护湖区蓝藻聚集规律及清除控制效果研究[D]. 江苏苏州: 苏州科技学院, 2012: 52. |
| [7] | Webster I T, Hutchinson P A. Effect of wind on the distribution of phytoplankton cells in lakes revisited[J]. Limnology and Oceanography, 1994,39(2):365-373. |
| [8] | 范帆, 李文朝, 柯凡. 巢湖市水源地铜绿微囊藻藻团粒径时空分布规律[J]. 湖泊科学, 2013,25(2):213-220. |
| [9] | George D G, Edwards R W. The effect of wind on the distribution of Chlorophyll A and crustacean plankton in a shallow eutrophic reservoir[J]. Journal of Applied Ecology, 1976,13(3):667. |
| [10] | 林卫青, 顾玉亮, 卢士强, 等. 防止藻类过度繁殖的青草沙水库合理水力停留时间初探[J]. 给水排水, 2009,35(9):60-62. |
| [11] | 黎尚豪. 常见中国淡水藻志[M]. 北京: 科学出版社, 1998. |
| [12] | Butterwick C, Heaney S I, Talling J F. Diversity in the influence of temperature on the growth rates of freshwater algae, and its ecological relevance[J]. Freshwater Biology, 2010,50(2):291-300. |
| [13] | 舒婷婷, 陈非洲. 微囊藻群体细胞数量估算的一种简单方法[J]. 生态科学, 2011,30(5):553-555. |
| [14] | Ishikawa K, Walker R F, Tsujimura S, et al. Estimation of microcystis colony size in developing water blooms via image analysis[J]. Journal of Japan Society on Water Environment, 2004,27:69-72. |
| [15] | Bernard C, Baker P, Robinson B, et al. Application of an image analysis system to enumerate and measure cyanobacteria[Z]. Austarlia: Cooperative Research Centre for Water Quality and Treatment, 2007. |
| [16] | Almesj? L, Rolff C. Automated measurements of filamentous cyanobacteria by digital image analysis[J]. Limnology and Oceanography Methods, 2007,5(4):217-224. |
| [17] | Jin C, Mmf M, Deglint J L, et al. Quantification of cyanobacterial cells via a novel imaging-driven technique with an integrated fluorescence signature[J]. Scientific Reports, 2018,8:9055. |
| [18] | Huang X, Huang Z, Chen X P, et al. The predominant phytoplankton of $Pseudoanabaena$, holding specific biosynjournal gene-derived occurrence of 2-MIB in a drinking water reservoir[J]. Environmental Science and Pollution Research, 2018,25:19134-19142. |
| [19] | Yentsch C S, Phinney D A. Spectral fluorescence: an ataxonomic tool for studying the structure of phytoplankton populations[J]. Journal of Plankton Research, 1985,7(5):617-632. |
| [20] | 殷高方, 赵南京, 胡丽, 等. 基于色素特征荧光光谱的浮游植物分类测量方法[J]. 光学学报, 2014,34(9):312-317. |
| [21] | Lee T Y, Tsuzuki M, Takeuchi T, et al. Quantitative determination of cyanobacteria in mixed phytoplankton assemblages by an in vivo fluorimetric method[J]. Analytica Chimica Acta, 1995,302(1):81-87. |
| [22] | Walker R F, Ishikawa K, Kumagai M. Fluorescence-assisted image analysis of freshwater microalgae[J]. J Microbiol Methods, 2002,51(2):149-162. |
| [23] | 靳雪莱. 基于荧光比值的优势藻门类识别和浓度测量方法研究[D]. 杭州: 浙江大学, 2018: 87. |
/
| 〈 |
|
〉 |